
Prometheus & Grafana 설치 및 테스트
Jun 9, 2025
»
os
Prometheus & Grafana 설치 및 테스트
IntelliJ 기준으로 설명하겠습니다.
✅ 1. Spring Boot 프로젝트 생성
▶ IntelliJ에서 새 프로젝트 만들기
- File → New → Project
-
Spring Initializr 선택 → Next
- 정보 입력:
- Group: com.example
- Artifact: prometheus-demo
- Packaging: Jar
- Java: 17 또는 21 (설정된 JDK 기준)
- Dependencies(의존성) 추가:
- Spring Web
- Spring actuator
- prometheus
→ Finish로 프로젝트 생성
✅ 2. application.yml
src/main/resources/application.yml로 아래처럼 설정합니다.
spring:
  application:
    name: prometheus-demo

management:
  endpoints:
    web:
      exposure:
        include: health,info,prometheus
  metrics:
    enable:
      all: true
    endpoint:
      prometheus:
        enabled: true
✅ 3. 사용자 정의 메트릭 등록 (코드 예시)
import io.micrometer.core.instrument.MeterRegistry;
import io.micrometer.core.instrument.Timer;
import org.springframework.web.bind.annotation.GetMapping;
import org.springframework.web.bind.annotation.RestController;

import java.time.Duration;

@RestController
public class MyApiController {

    private final MeterRegistry registry;

    public MyApiController(MeterRegistry registry) {
        this.registry = registry;
    }

    @GetMapping("/api/slow")
    public String slowApi() throws InterruptedException {
        Timer.Sample sample = Timer.start(registry);
        try {
            Thread.sleep(1000); // 일부러 느린 API
            return "slow!";
        } finally {
            sample.stop(Timer.builder("api.response.time")
                .description("API 응답 시간")
                .tag("endpoint", "/api/slow")
                .register(registry));
        }
    }
}
✅ 4. Prometheus 설치 및 설정 (도커 기준)
prometheus.yml 파일 생성
# vi prometheus.yml

global:
  scrape_interval: 5s

scrape_configs:
  - job_name: 'spring-boot-app'
    metrics_path: '/actuator/prometheus'
    static_configs:
      - targets: ['host.docker.internal:8080']  # 로컬에서 도커 실행 시
✅ 5. 도커로 실행
docker run -d -p 9090:9090 \
  -v $(pwd)/prometheus.yml:/etc/prometheus/prometheus.yml \
  prom/prometheus
✅ 6. Grafana 설정 (도커 기준)
docker run -d -p 3000:3000 grafana/grafana
prometheus 는 설정파일을 만들어서 docker 실행하고,
grafana 는 곧 바로 실행 한 이유는
prometheus 는 설정 경로가 아래와 같이 지정 되어 있어서 설정 파일이 필수
/etc/prometheus/prometheus.yml
✅ 6-1. Grafana 대시보드 확인
http://localhost:3000접속- 기본 로그인 :
admin / admin - 데이터 소스 추가 → Prometheus 선택 → URL:
http://host.docker.internal:9090 - 대시보드 만들기
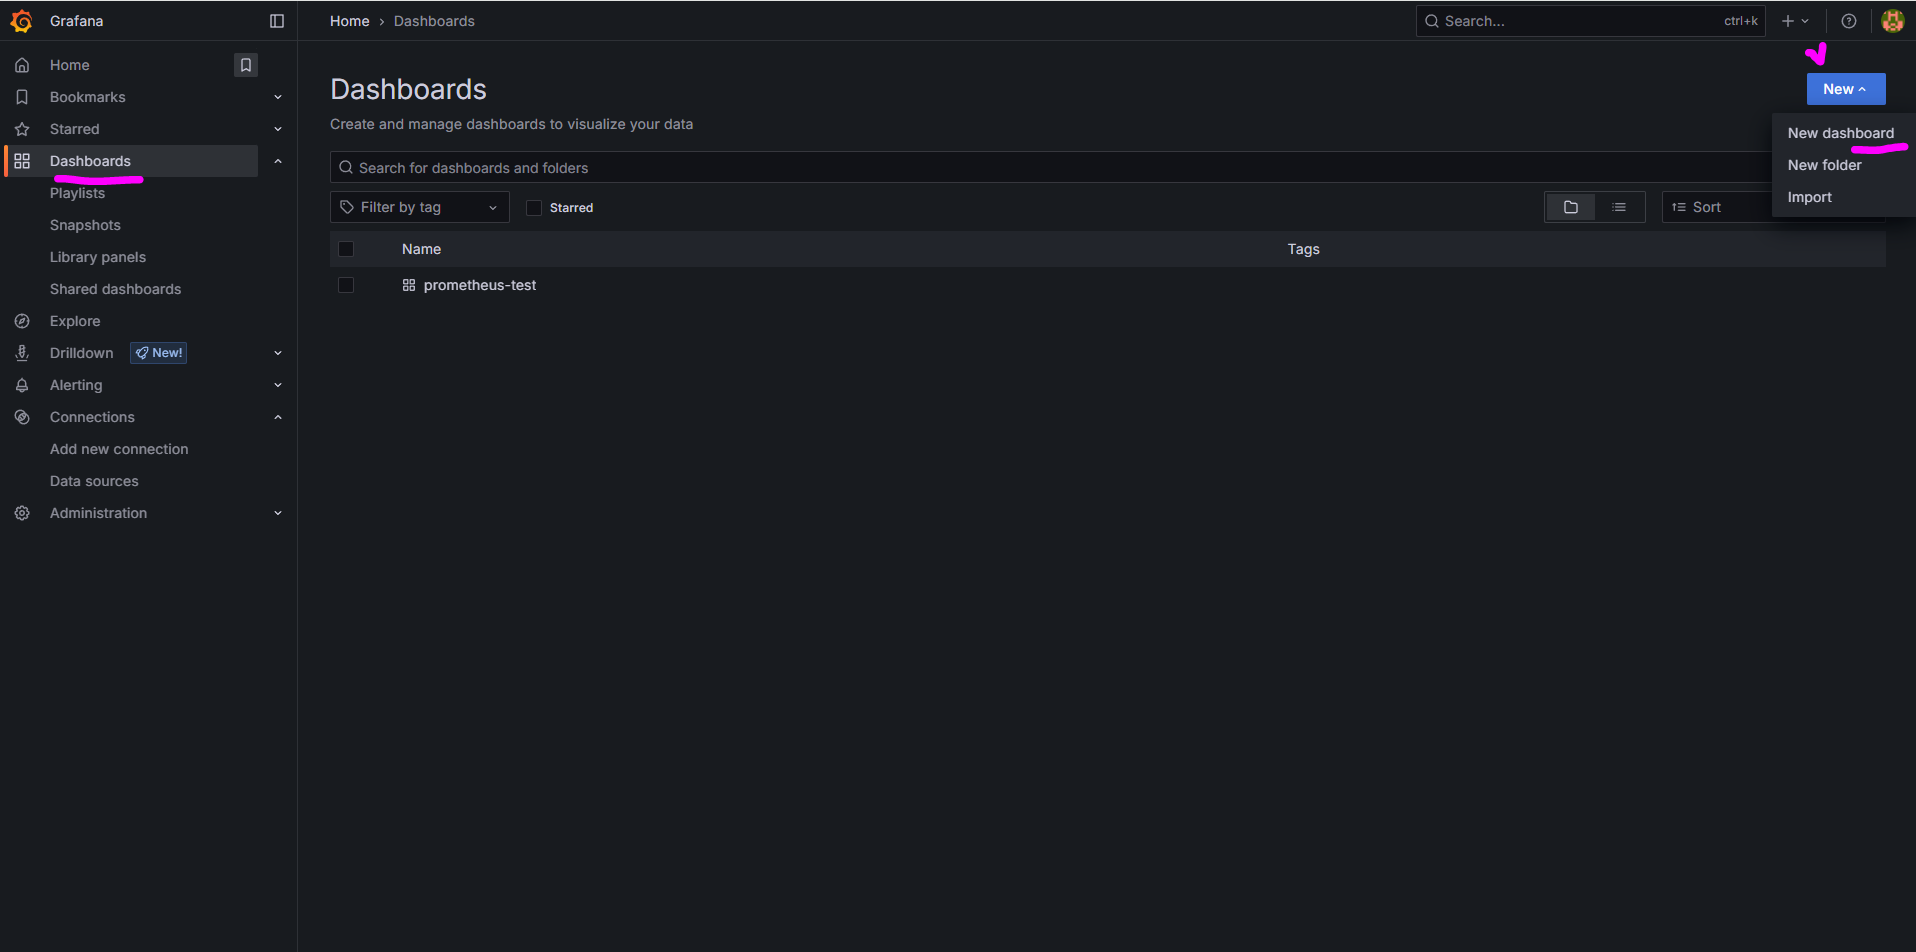
왼쪽 메뉴 Dashboards 클릭 -> 우측 New -> New dashboard 클릭
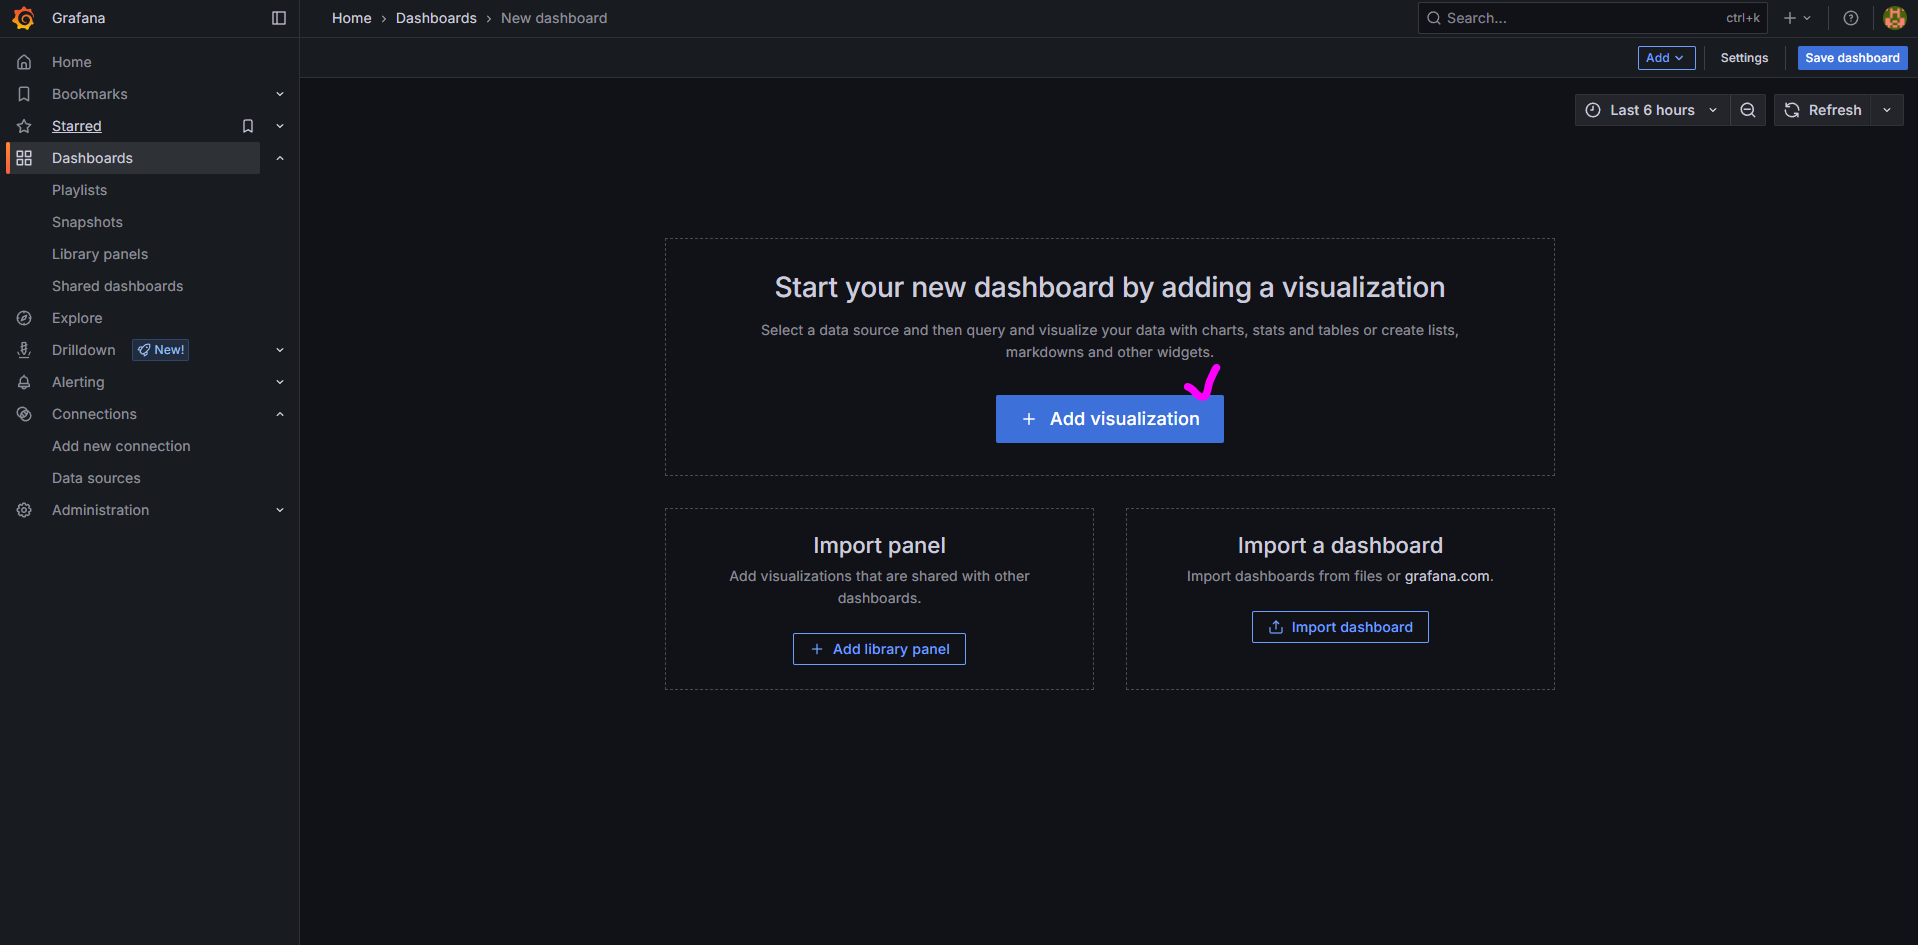
Add visualization 클릭
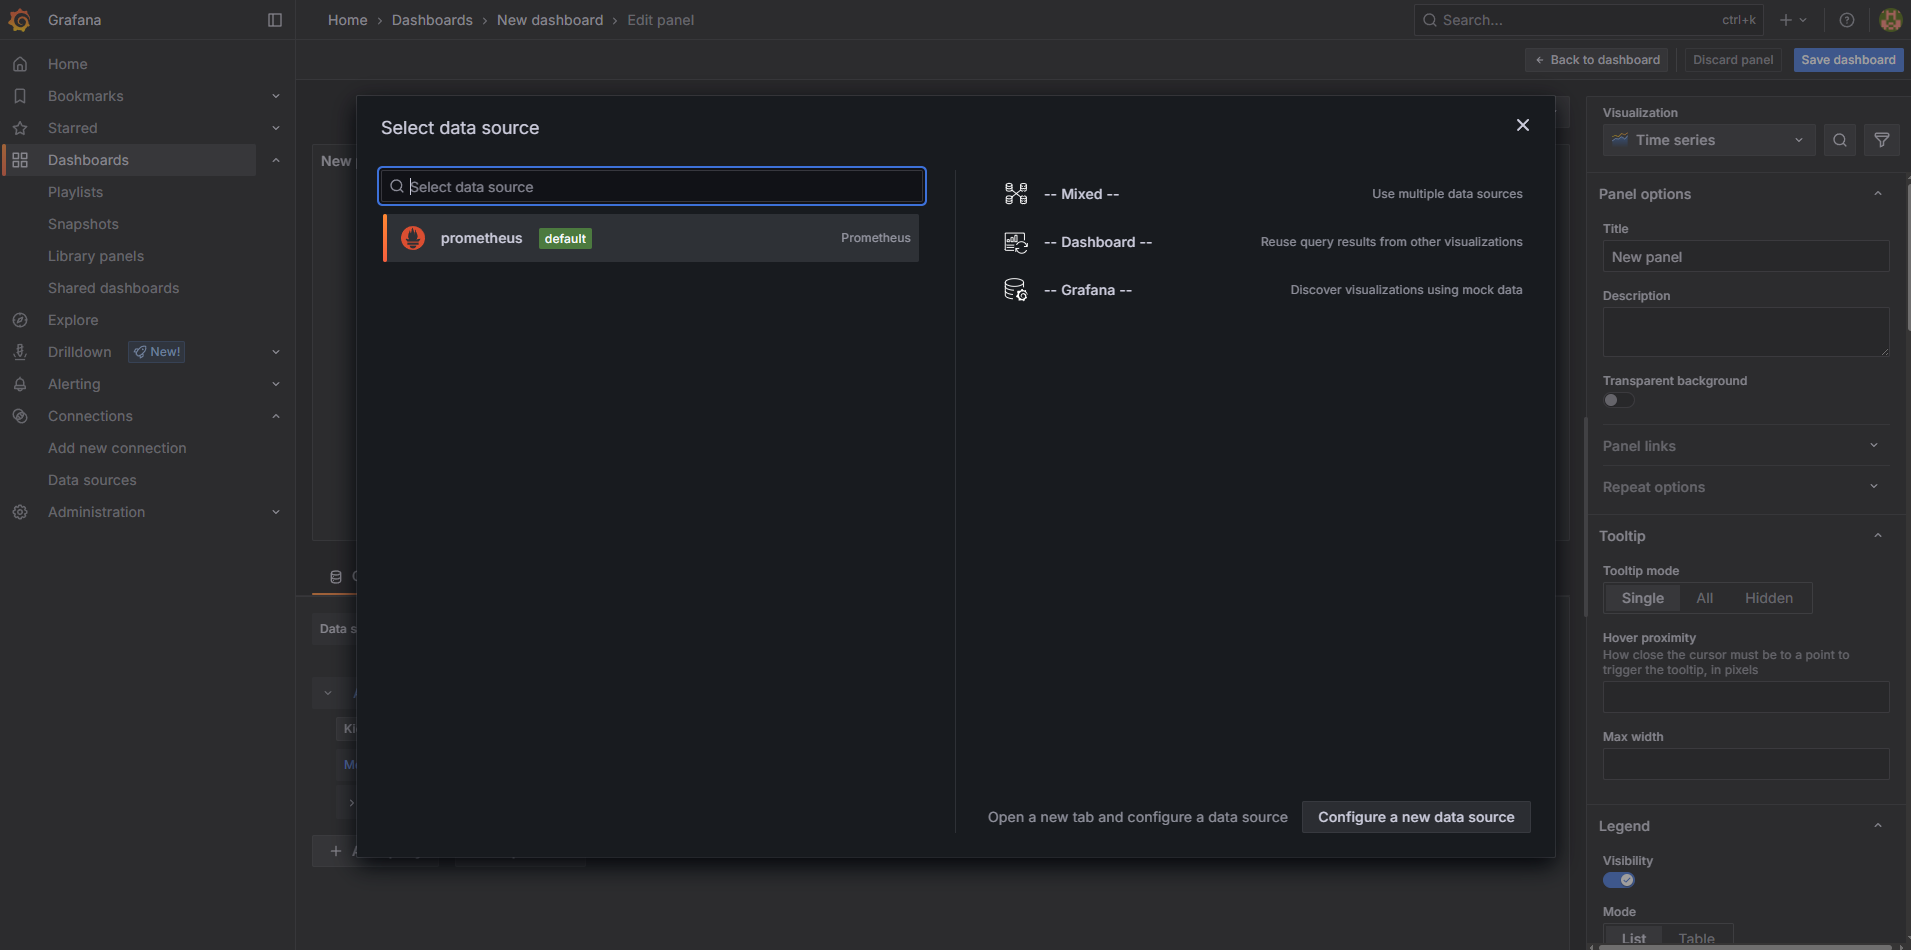
prometheus 선택
하단 Queries 탭 -> A 쿼리에 Code 로 변경 후 아래 쿼리 입력
api_response_time_seconds_count{endpoint="/api/slow"}
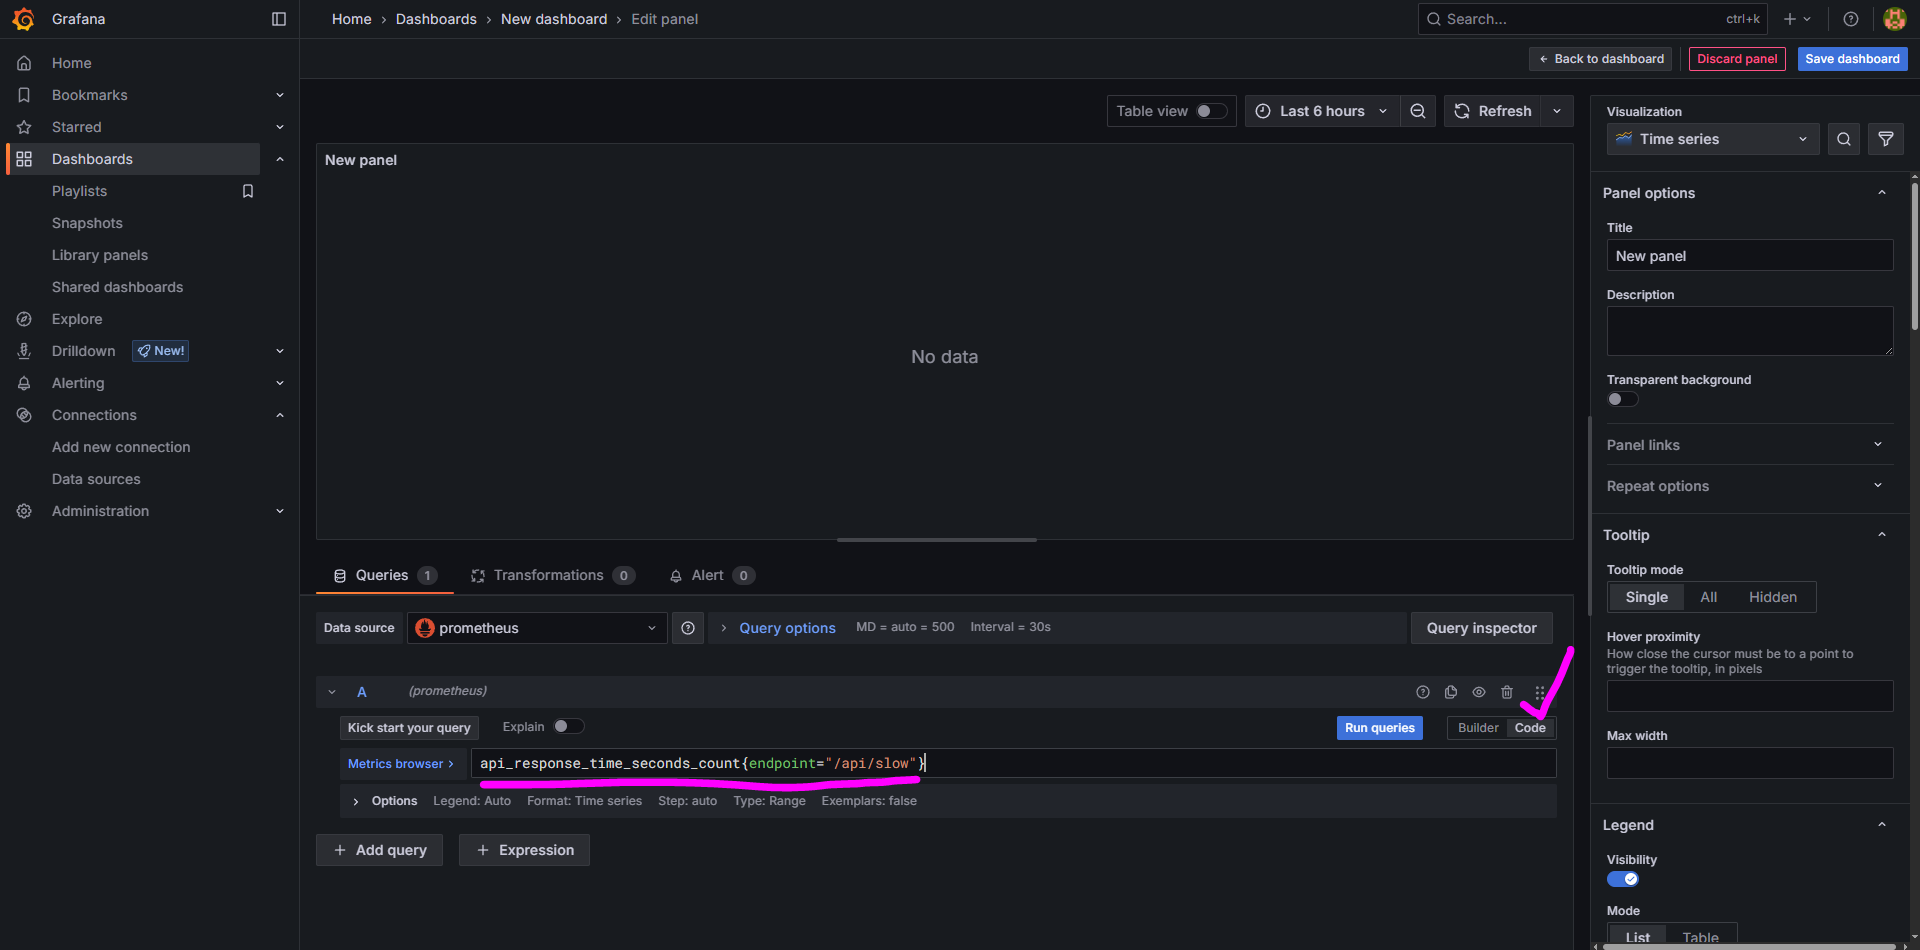
Add query 버튼 클릭하여, 아래 쿼리 추가
rate(api_response_time_seconds_sum[1m]) / rate(api_response_time_seconds_count[1m])
A쿼리 : /api/slow 에 대한 초당 응답 개수
B쿼리 : endpoint 별 평균